
Why Cooling Inflation Won’t Cut Prices in 2026–27
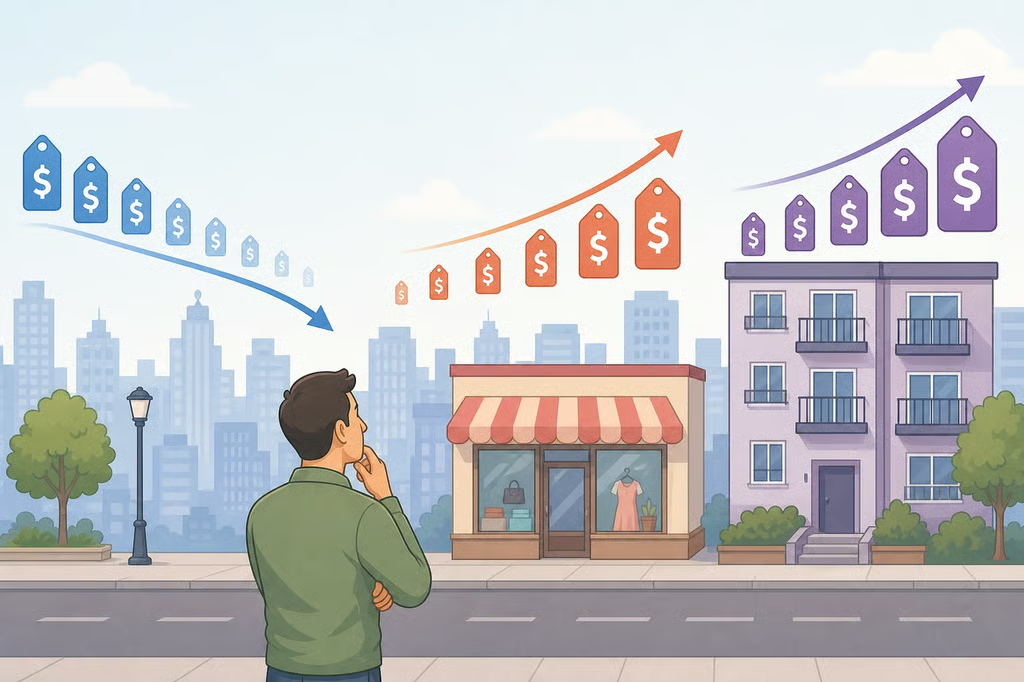
Households hoping for cheaper groceries, lower rent, or smaller insurance bills may be waiting for the wrong signal. When inflation slows, prices are still rising, just at a slower pace. A broad return to pre-2022 prices would require deflation, meaning prices across the economy would need to fall for a sustained period.
That distinction matters as readers weigh inflation forecasts for 2026 and 2027. A useful forecast needs to be read alongside its measure, publication date, time horizon, and assumptions. A national inflation rate can help with household planning, but it cannot predict one family’s lease renewal, grocery receipt, or insurance bill.
The earlier inflation surge also changed the price level itself. Even if inflation returns to a more typical pace, many prices will continue from a higher starting point. The practical question is not simply whether inflation will go down. It is which costs may rise more slowly, which may remain stubborn, and which individual categories could temporarily fall.
Disinflation is not a price rollback
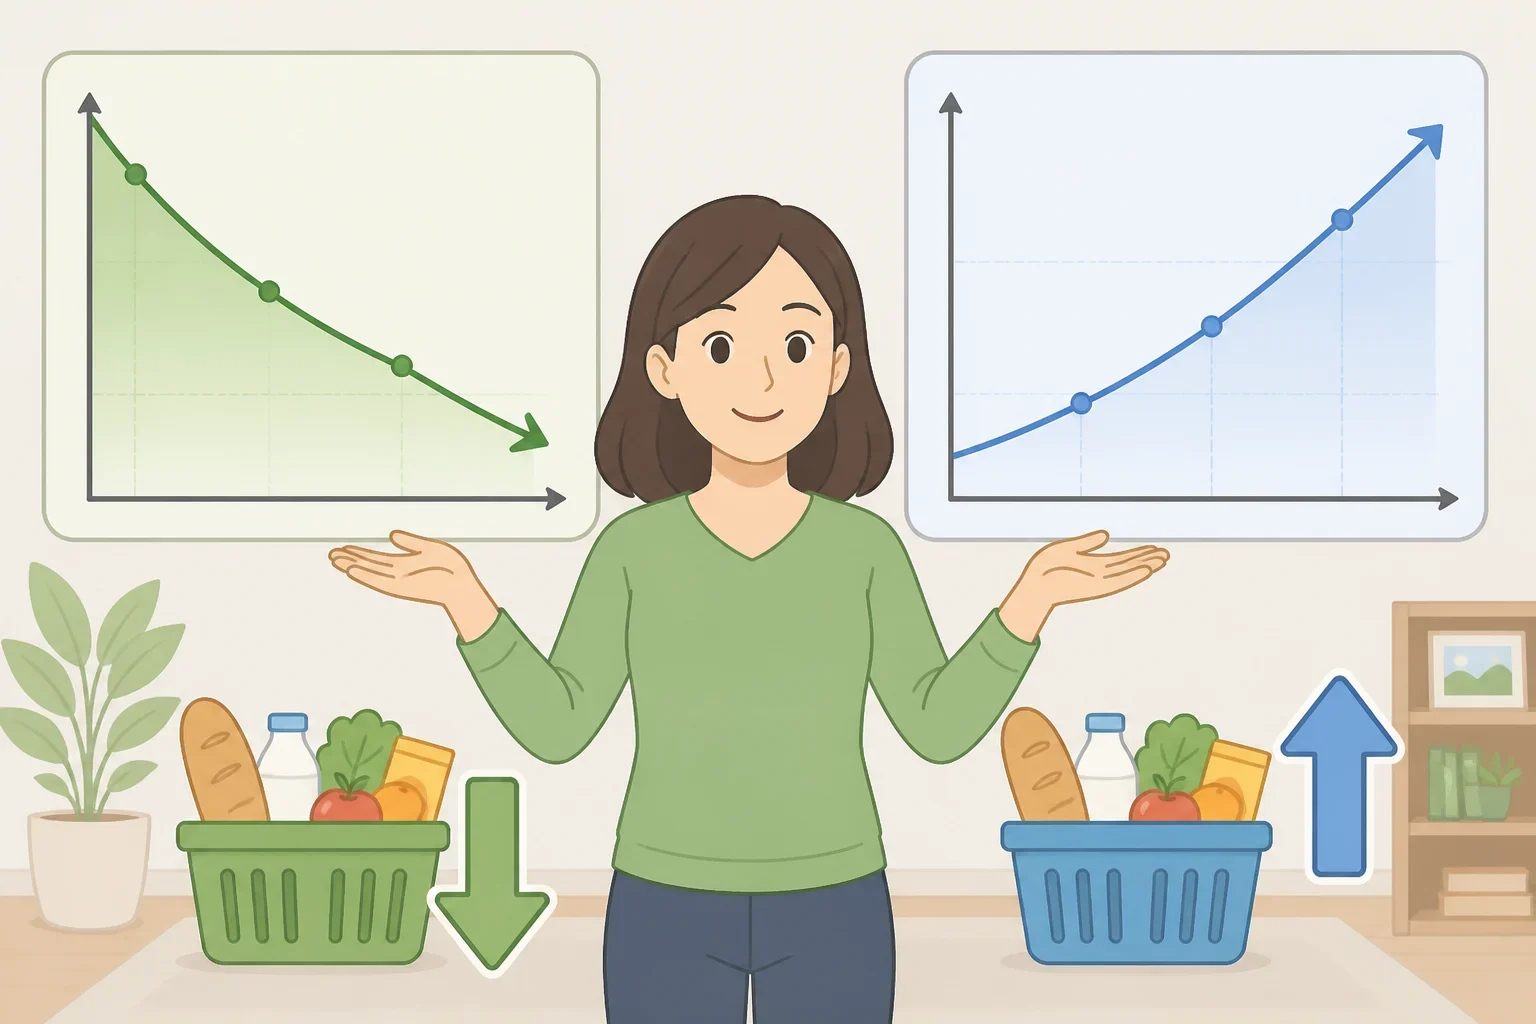
Inflation measures the rate at which prices change. Disinflation means that rate is slowing. Deflation means prices are declining across the economy, not just dropping for a few products or in a single category.
Consider a household whose grocery spending climbed during the earlier inflation surge. If food prices rise more slowly afterward, the monthly bill may become easier to predict. The bill does not automatically return to its old level. A sale, a cheaper substitute, or a temporary drop in one product can provide relief without reversing the broader price increase.
That is the first test for any forecast that promises improvement: Is it describing slower increases or lower prices? Those are different outcomes, and the difference shows up quickly in a household budget.
The Federal Reserve’s inflation target uses the Personal Consumption Expenditures price index, commonly called PCE inflation. That measure is different from the Consumer Price Index, or CPI, which receives more attention in household news coverage. A forecast for headline CPI should not be placed beside a forecast for core PCE as if the two figures describe the same basket of spending.
Core readings also leave out food and energy, making them useful for assessing underlying price movement but less directly connected to a family’s complete monthly expenses. A household may feel a sharp change in groceries or gasoline even when a core measure looks calmer.
A forecast can still be useful without matching a household’s experience exactly. It simply needs to be read for what it measures.
What to check in a 2026 or 2027 forecast
Forecast comparisons become difficult when numbers appear without labels. Before treating a projection as good news or bad news, check five details:
- The source and release date: A projection reflects the information available when it was published.
- The index: The forecast may cover CPI, PCE, core CPI, or core PCE.
- The forecast horizon: “This year” can mean something different from a calendar-year projection or a year-over-year reading.
- The statistic: A central bank may publish a median estimate, while a survey may report an economist median or another summary.
- The household connection: The index may include categories that do not make up a particular family’s budget.
The Federal Reserve calendar shows when Federal Open Market Committee meetings and related releases are scheduled. Fed projections can help readers understand policymakers’ expectations, but they are not promises about where prices will land.
A survey of professional economists provides a different reference point from a central-bank projection. It can show how a group views the path ahead rather than presenting one institution’s outlook. The result still needs to be read alongside the poll date and the measure being forecast. A CPI estimate cannot be compared directly with a core PCE estimate simply because both are labeled “inflation.”
Kiplinger’s economic forecasts offer another panel-based perspective. The relevant quarterly edition matters because forecasts change as new information arrives. A panel may also use a different inflation measure or forecasting assumption than the Federal Reserve or an economist survey.
The goal is not to find one perfect number. It is to see whether several sources agree on the direction, how wide the range is, and which risks they identify. A small difference may reflect different measures. A larger gap may reflect different assumptions about housing, wages, trade policy, or consumer demand.
Without those labels, a forecast can sound more precise than it really is.
Why forecasts can diverge
Forecast disagreement does not necessarily mean economists disagree about everything. Two forecasters can expect inflation to ease while assigning different weight to the forces that could slow or interrupt that progress.
Shelter moves on a different timetable
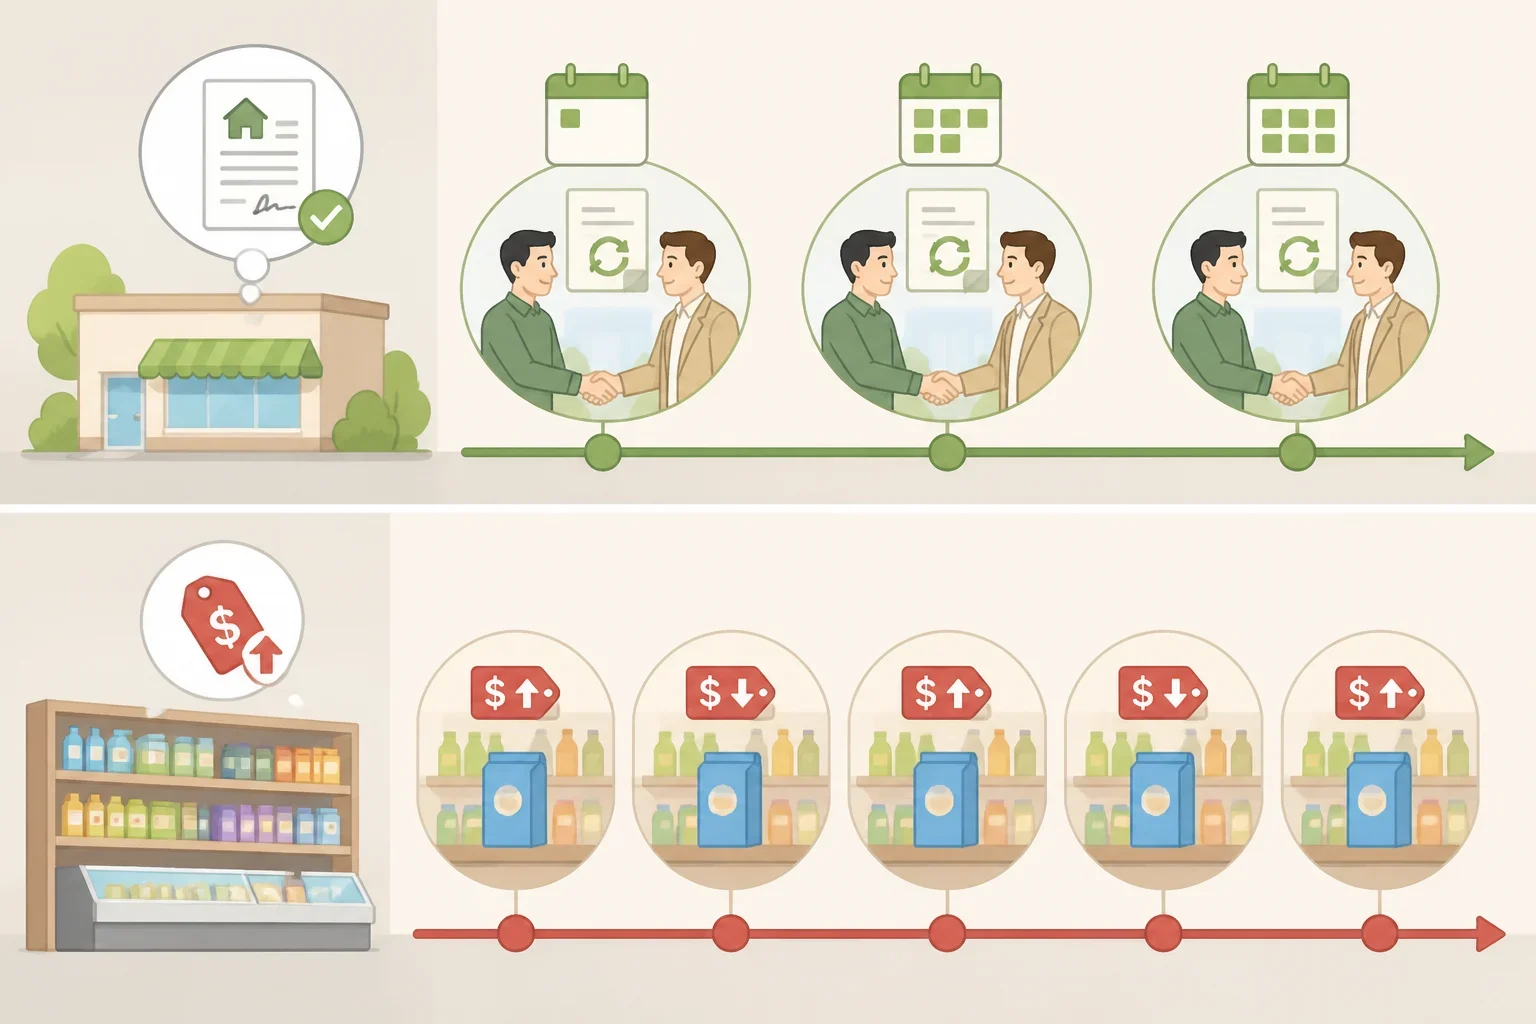
Shelter costs, including rent and owners’ equivalent rent, can respond more slowly than prices for goods sold in stores. Many renters encounter a new price when a lease is renewed or a home is listed, rather than every time they shop.
Owners’ equivalent rent is also easy to misread. It estimates the value of housing services for the national price index. It is not a monthly mortgage payment sent to a landlord, and it is not a direct bill for every homeowner.
That makes shelter data relevant to the broader inflation picture without making it a personal housing-cost forecast. A renter watching a renewal notice may care about shelter immediately. A homeowner with a fixed-rate mortgage may be more concerned about insurance, repairs, utilities, or the cost of moving.
The timing creates a gap between national data and household experience. A forecast that expects shelter inflation to cool gradually may feel encouraging to one household and frustrating to another, depending on lease timing and local conditions.
Goods and services do not move together
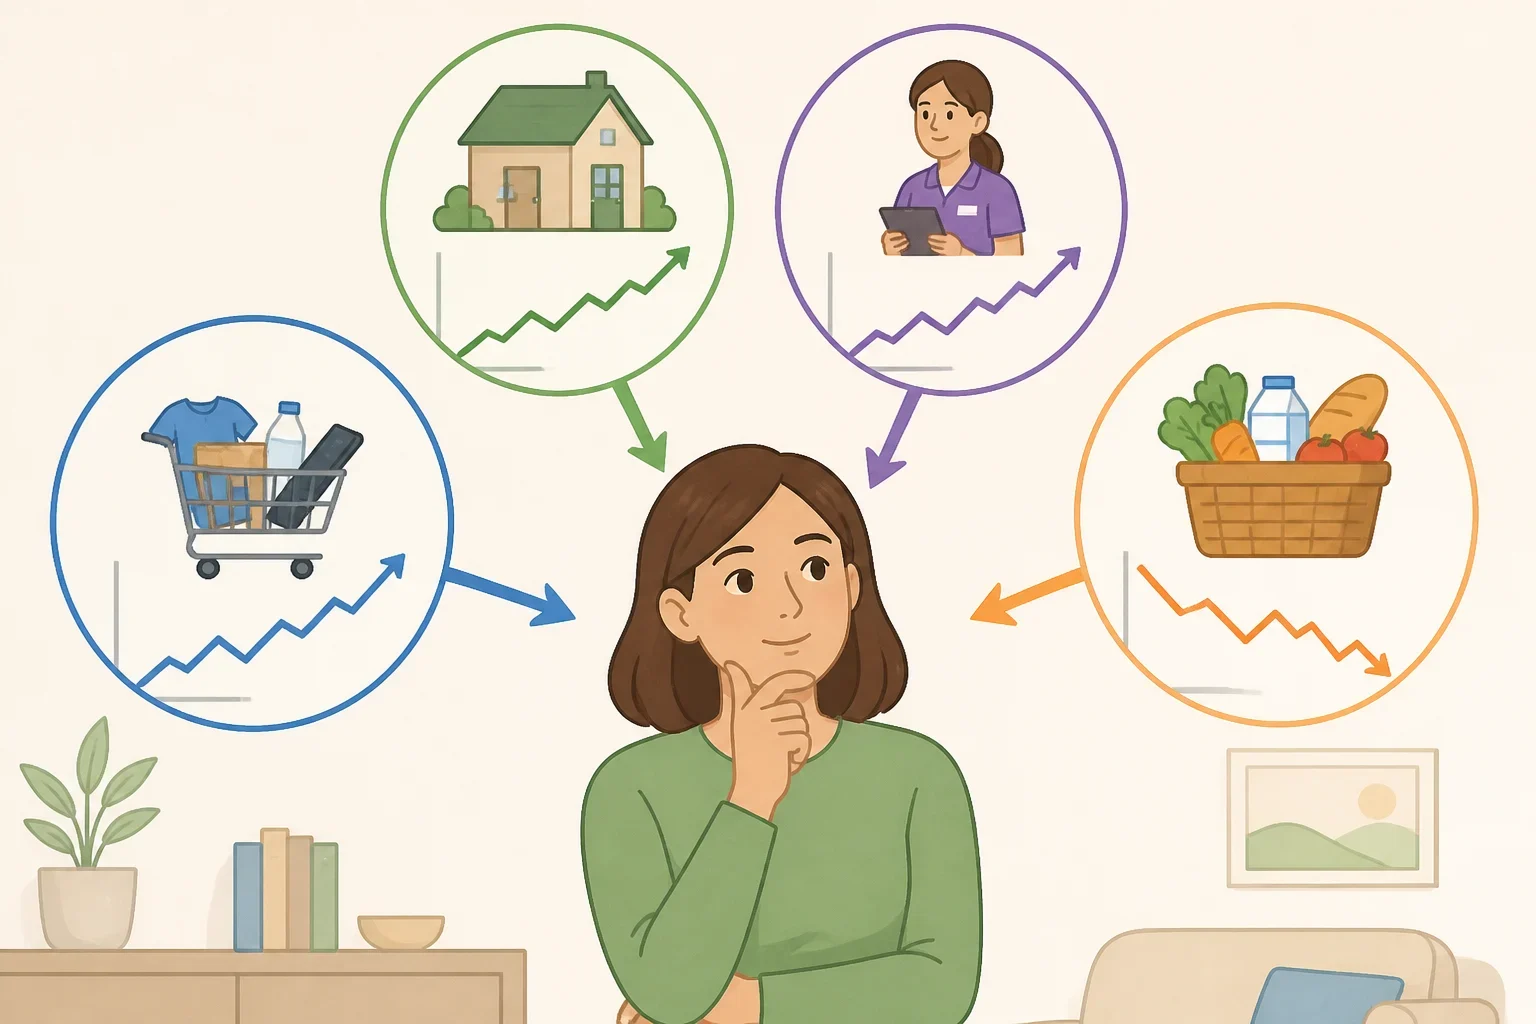
The overall inflation rate combines goods and services, but those categories can behave very differently. Some physical goods may become cheaper for a time as supply improves, demand changes, or retailers discount excess inventory. That does not mean rents or labor-intensive services will follow the same path.
Food provides a useful example. Grocery prices and restaurant prices belong to different spending categories, so a household that cooks most meals at home should pay closer attention to food-at-home data than to restaurant prices.
Even then, the national category is only an average. Brand choices, package sizes, store locations, promotions, dietary requirements, and changes in what a family buys can push an individual receipt in a different direction.
Services can be similarly uneven. Child care, repairs, personal services, and other labor-intensive expenses may not change at the same speed as electronics, clothing, or other goods. That does not mean every service will rise faster than goods, or that labor costs explain every price change. It does mean a household budget can feel pressure in services even when some store prices are stable.
Trade policy can add uncertainty
Tariff policy is another reason an inflation outlook may vary. Forecasters may reach different conclusions about how changes in trade policy affect costs, how quickly businesses pass those costs through, and whether consumers or suppliers absorb part of the increase.
A commentary from an independent forecasting firm can show how one economist is interpreting tariff risks, but it does not establish the size of an economy-wide effect by itself. Moody’s Analytics is one perspective to compare with central-bank projections, surveys, and official data.
The useful question is not whether one forecast sounds confident. It is whether the assumptions are visible and whether the forecast still makes sense when the measure, date, and household category are separated.
What the outlook means for common household costs
Rent
A slower national shelter increase would not guarantee lower rent. It could mean that new leases or renewals rise less quickly than they did during a stronger housing market. The timing may vary widely from one property or neighborhood to another.
Readers comparing a rent increase should look at the renewal notice, comparable local listings, and the longer trend in shelter data. One inflation report is too narrow to explain one lease decision.
Homeownership
Owners’ equivalent rent should not be treated as a forecast for a homeowner’s mortgage payment. It can describe a national housing-cost trend, but it does not replace checking the bills that actually arrive.
For household planning, separate the costs into their real categories: mortgage or rent, property taxes, maintenance, utilities, and insurance. A broad shelter forecast may be relevant when considering a move, but it does not determine the cost of a roof repair or a specific policy renewal.
Groceries
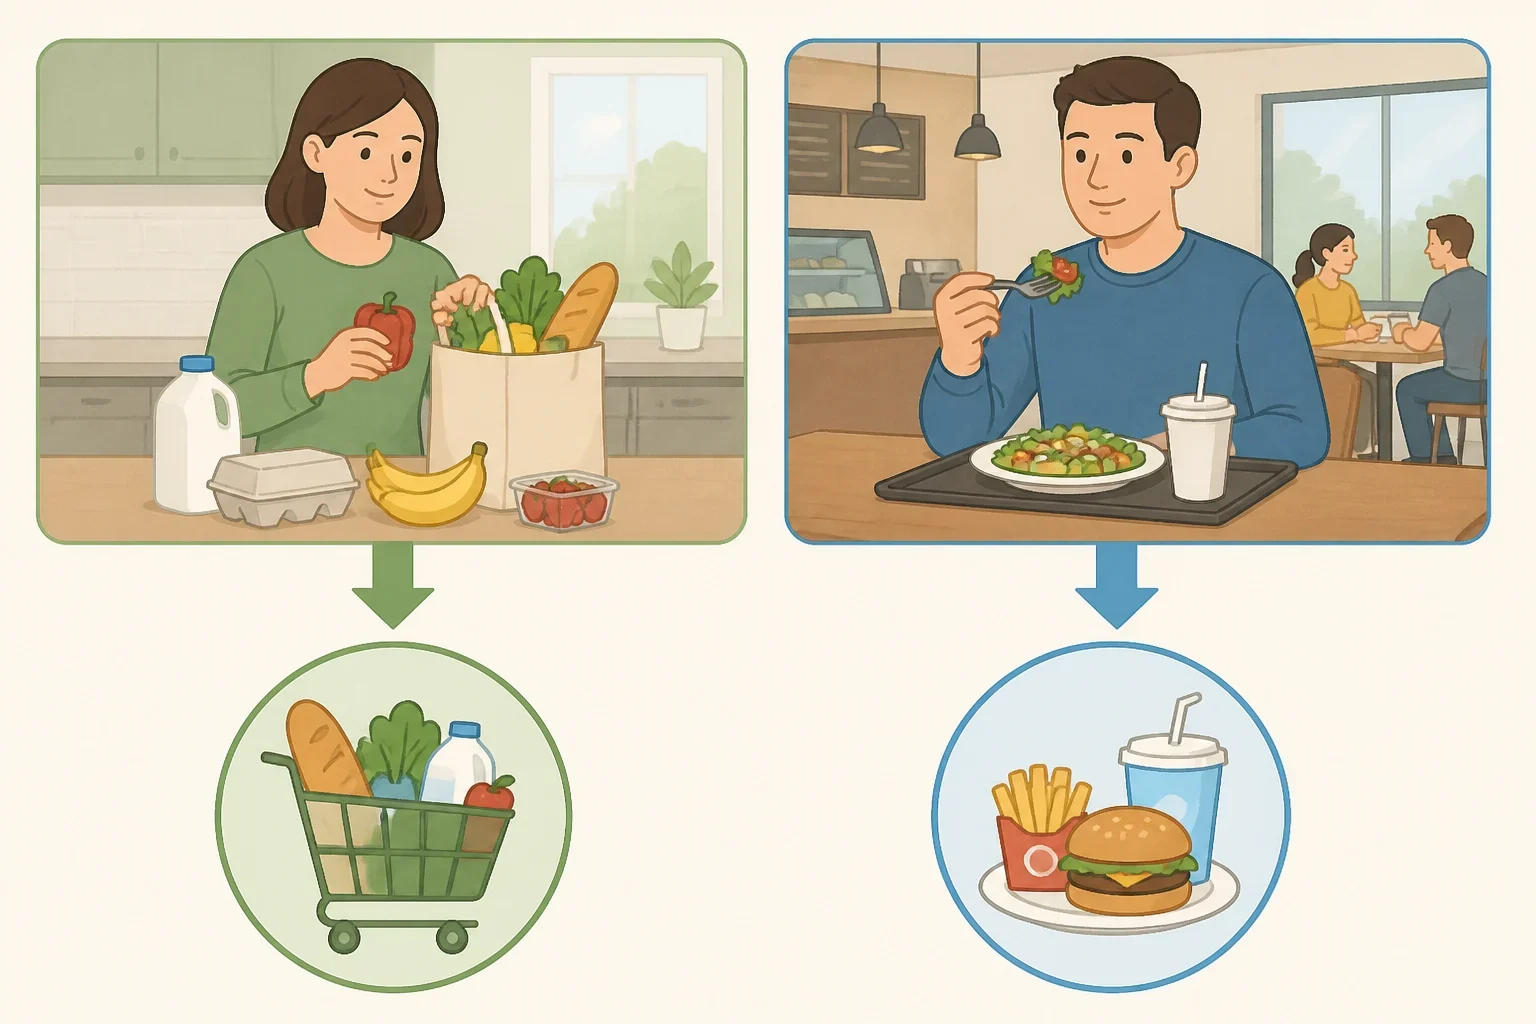
Food-at-home inflation is the more relevant measure for grocery shoppers. Still, slower growth does not mean the total receipt will fall. A family may see relief from promotions or lower prices in one category while paying more for another.
Tracking grocery spending over several months gives a clearer picture than reacting to one shopping trip. Compare the household’s receipts with the food-at-home category, while remembering that the national index represents an average basket.
Transportation and insurance
Transportation needs to be broken into separate pieces. Fuel, vehicle prices, maintenance, and motor vehicle insurance can move differently, so the word “transportation” alone is too broad to explain a household’s costs.
The same caution applies to insurance. A national measure for motor vehicle insurance, for example, should not be treated as a prediction for homeowners insurance or a particular renewal notice. Check the exact category before drawing a conclusion from an inflation report.
Everyday services
Services may be the expense category that feels least connected to falling prices in stores. Repairs, child care, and personal services are purchased locally and may reflect staffing, rent, demand, and business costs as well as the broader inflation rate.
That does not make a national forecast irrelevant. It makes the forecast a background signal rather than a household-specific answer. Compare the relevant service bill over time, and avoid assuming that one broad rate applies evenly to every provider.
A practical way to follow the next release
When a new inflation forecast or CPI report appears, use a short checklist:
- Identify the measure. Confirm whether it is headline CPI, core CPI, headline PCE, or core PCE.
- Check the publication date. A forecast issued earlier in the year may reflect different conditions from one issued later.
- Find the category that matters most. Use shelter for rent, food at home for groceries, and the specific transportation or insurance component for those expenses.
- Compare several months, not one report. Monthly figures can move around, while a longer view shows whether a change is lasting.
- Compare the data with actual bills. Renewal notices, receipts, premiums, and repair estimates are more useful for household decisions than a headline number alone.
The clearest expectation for 2026 and 2027 is moderation rather than a reset. Slower inflation could make future price increases less severe, but it does not erase the increases that already happened. Some goods may become cheaper for a period, while shelter, services, or a particular household bill continue moving higher.
For the next budgeting check, start with the largest recurring expense. Identify its matching inflation category, review six to 12 months of actual bills, and then use the broader forecast as context. That approach will not predict every price, but it will give the forecast a practical place in the household plan.
