
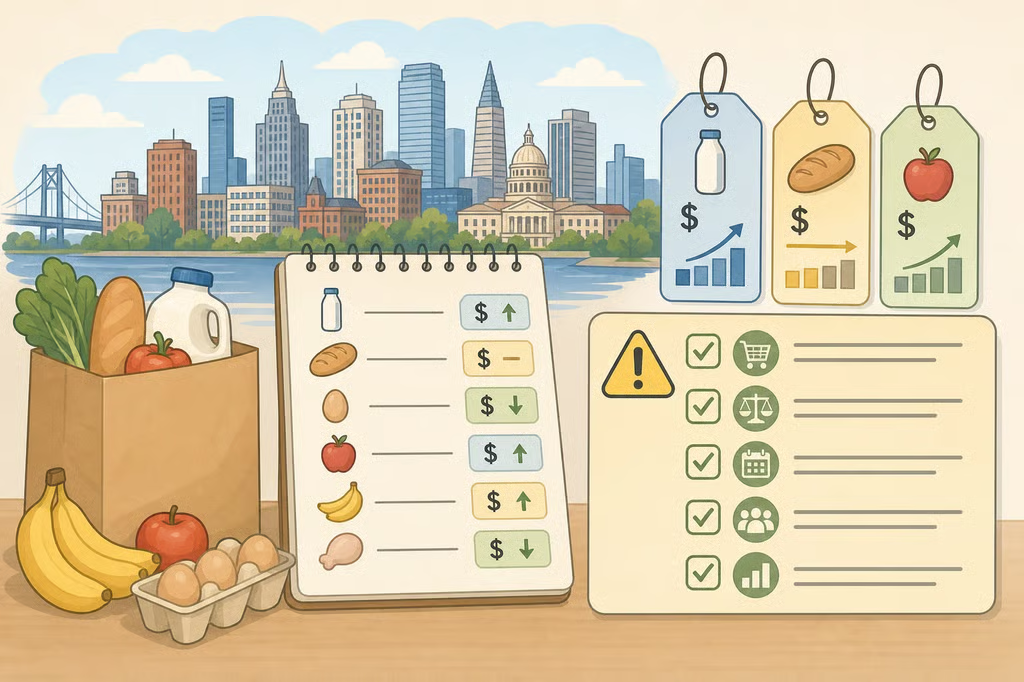
- Checklist for U.S. cities with the highest grocery prices in 2026
- What a grocery price index actually measures
- Why the data volume helps, and where it stops helping
- Three details to verify before comparing cities
- Keep the grocery measure separate from the total cost-of-living score
- Turn an index into a household budget check
- A practical checklist before acting on a ranking
Checklist for U.S. cities with the highest grocery prices in 2026
A grocery index can help compare food prices between places, but it cannot predict a household’s monthly bill on its own. Before using a claim about the U.S. cities with the highest grocery prices in 2026 to plan a move or reset a budget, check four things: the geography being measured, the time period, the items included, and the index’s baseline.
That distinction matters because a city can be expensive overall without having the highest grocery costs by city. The C2ER Cost of Living Index combines housing, utilities, grocery items, transportation, health care, and miscellaneous goods and services into one composite measure, while also identifying communities with the highest and lowest food costs through a separate grocery item index. C2ER described those measures in a release published seven weeks ago.
The supplied C2ER material does not provide a verified city-by-city ranking, the index values behind one, or enough geographic and baseline information to responsibly name the most expensive cities for groceries in America. That makes the useful question slightly different: What can a grocery index tell a household, and how should the number be tested before it affects a real budget?
What a grocery price index actually measures
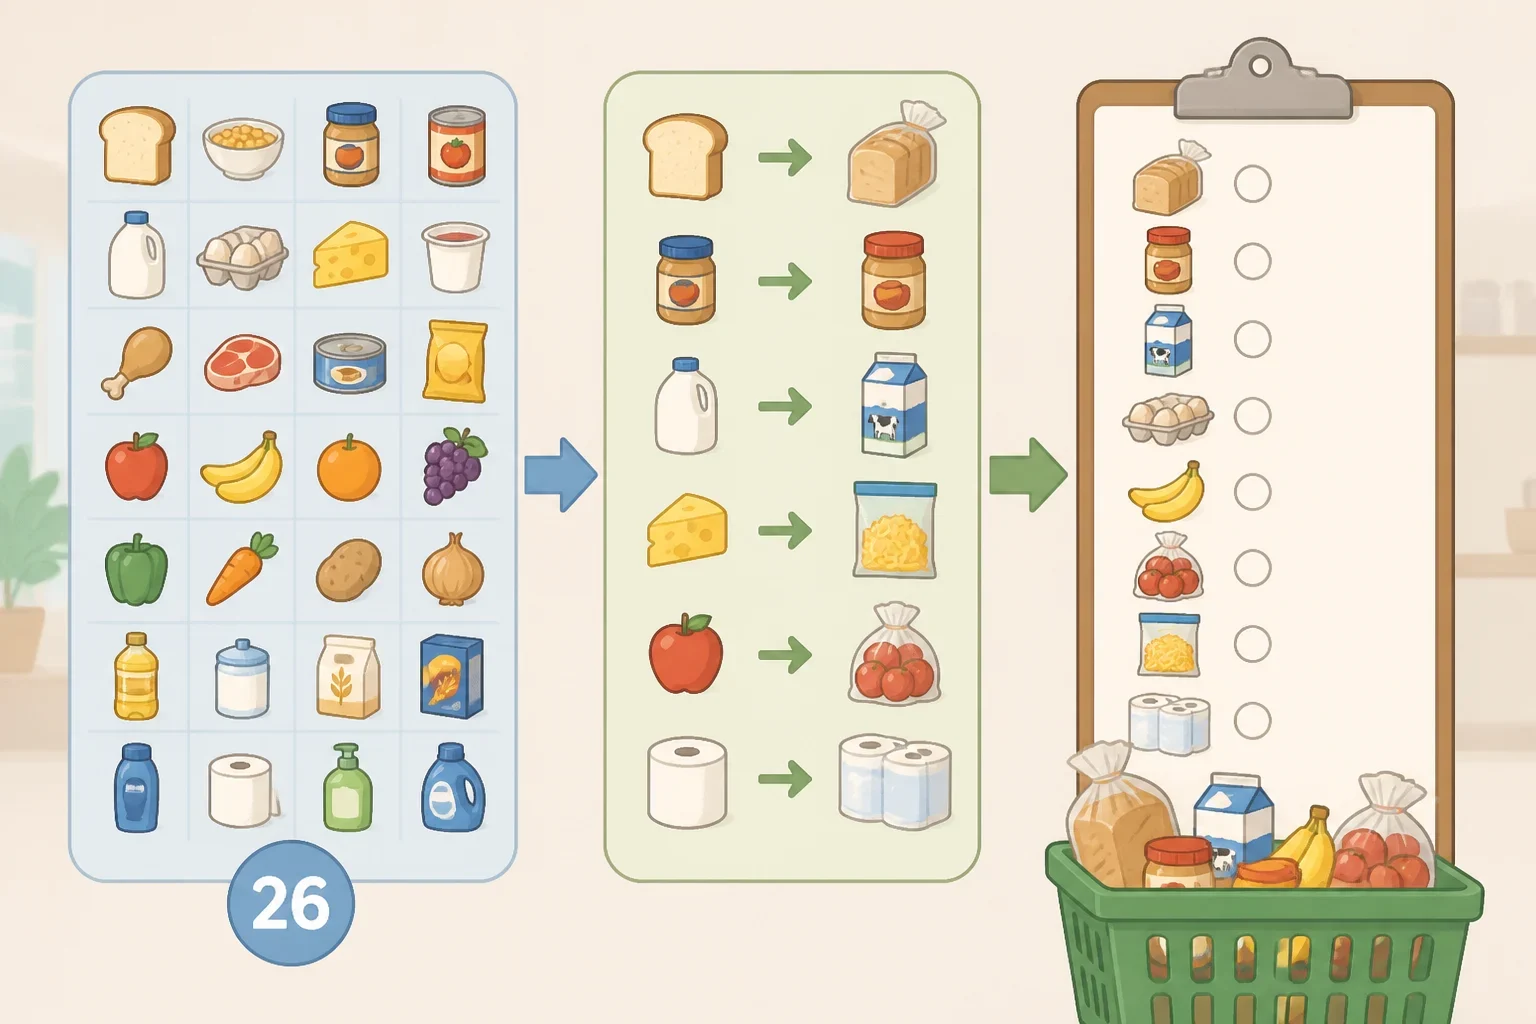
C2ER’s grocery measure is not a record of everything shoppers buy. It uses 26 items drawn from different surrogate categories to represent the grocery item component of the broader index. C2ER reports that those items are priced as stand-ins for wider grocery categories.
That design gives the comparison a consistent frame. Every location is being evaluated against the same general set of goods rather than an improvised list chosen by whoever happens to be collecting prices. It also creates a clear limit: the result describes relative prices for selected items, not the actual spending pattern of a family, couple, single adult, or household with special dietary needs.
A shopper who buys mostly fresh produce, specialty ingredients, infant formula, prepared foods, or organic products may experience a different food budget from a shopper whose routine centers on packaged staples. Neither household is necessarily represented perfectly by a short standardized set of surrogate categories.
The difference between price and spending is just as important. An index may show that selected goods cost more in one location than another, but it does not reveal how often a household shops, whether it cooks at home, how much food it wastes, which stores it uses, or whether it relies on sales and loyalty discounts. Those choices affect the monthly total even when the underlying local prices are similar.
Why the data volume helps, and where it stops helping
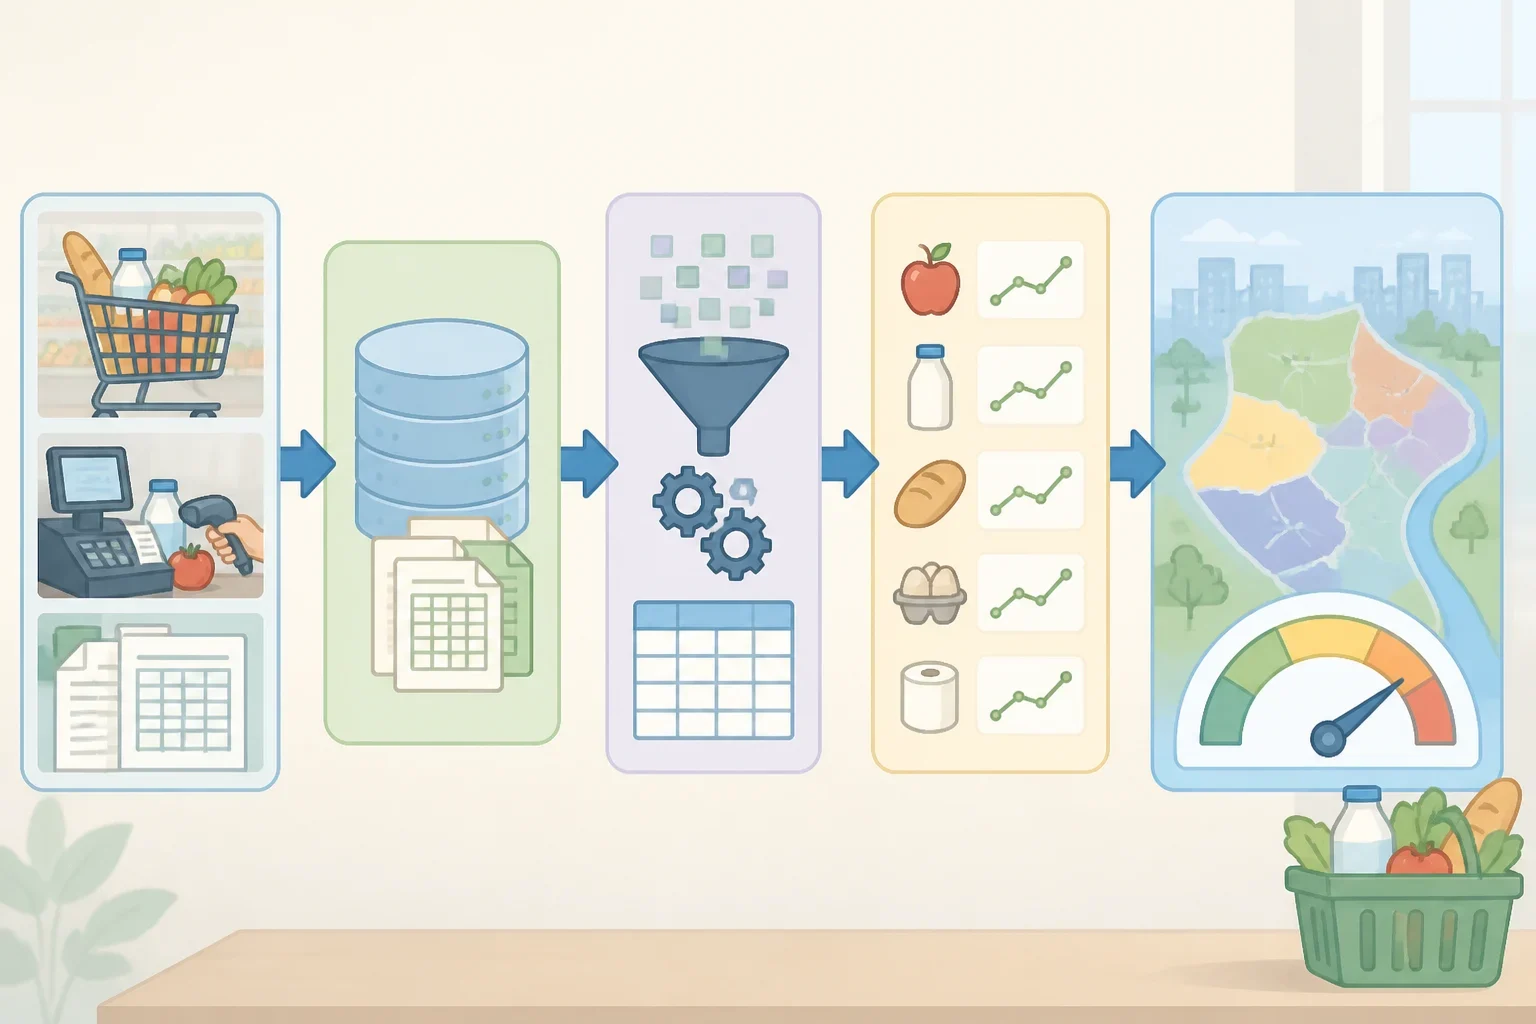
The underlying collection is broad. C2ER says Datasembly’s weekly collection covers 200 national and regional retailers and quick-service restaurants, representing more than 150,000 brick-and-mortar locations across 30,000 ZIP codes. C2ER also describes the grocery index as drawing on more than 320 million grocery prices derived from 1.5 trillion historical data points collected across the country.
That scale may make the information a useful starting point for comparing locations. A broad collection can offer a wider view than one shopper’s receipt, one store’s shelf tags, or a small local survey. Still, the available research does not explain every step between the larger data system and the 26 grocery items used in the index.
In particular, the supplied C2ER material does not spell out how the historical data points are weighted, how prices from different retailers contribute to the grocery measure, or how the final city-level figures are calculated. The safest reading is that C2ER describes both a substantial underlying data operation and a separate grocery-item measure, but the supplied information does not establish that every data point flows directly into the 26-item result.
That uncertainty does not make the index useless. It sets the proper boundary around it. The number can help a reader decide which locations deserve a closer look. It should not be treated as a receipt, a guaranteed percentage increase, or a complete forecast of food spending.
Three details to verify before comparing cities
A headline that names the U.S. cities with the highest grocery prices in 2026 may sound definitive. The details underneath determine whether the comparison is useful.
Check the geography

First, find out what the location represents. Is the figure for a city proper, a metropolitan area, or participating communities associated with a broader region? Those are not interchangeable.
A city-proper measure may reflect prices within a particular municipal boundary. A metro-area measure can include nearby communities with different store options, rents, transportation patterns, and competitive pressures. A list of participating communities may describe only the places included in the data collection, not every location a reader casually associates with the city.
The supplied research does not establish the geographic definition for a particular C2ER ranking. That definition needs to be confirmed from the release or methodology before comparing two places. Otherwise, a reader may compare a dense urban core with a wider suburban region and assume the numbers describe the same kind of place.
Check the period
C2ER’s cited release concerns the second quarter of 2026, and the organization describes the measure as part of a quarterly index. C2ER A quarterly result describes a defined period. It should not automatically be treated as a permanent statement about prices throughout the year.
The research supplied here does not establish how much any result changes across seasons or how long a particular price observation remains in the calculation. That is a reason to read the period carefully, not a reason to assume a seasonal pattern.
For a household making a move or signing a lease, the timing question is practical. A comparison from one quarter may be a helpful screening point, but current store prices in the neighborhood under consideration are still worth checking before the decision becomes expensive to reverse.
Check the baseline
An index value has meaning only in relation to the baseline used to create it. Before comparing scores, confirm what the reference point represents and whether both locations were calculated against the same reference.
Do not assume that a score of 100, an average, or any other familiar benchmark means the same thing across every index. The supplied C2ER research does not state the baseline details needed to interpret a specific score, so a ranking without that context is incomplete.
The baseline also affects how a difference should be used. If two locations were measured with different geographic definitions or reference points, subtracting one score from the other could create a neat-looking comparison that does not represent a real difference in shopping costs.
Keep the grocery measure separate from the total cost-of-living score
C2ER’s composite index has six components: housing, utilities, grocery items, transportation, health care, and miscellaneous goods and services. C2ER That structure is useful for understanding why a city’s overall cost-of-living reputation cannot answer a grocery-specific question.
A high composite score may be influenced by housing or transportation rather than food. A location with a lower overall score may still have grocery prices that deserve attention. Those are hypothetical examples, not findings about particular cities in the supplied data, but they show why the two measures should not be blended.
For a household considering relocation, the distinction can change the order of research. Someone focused on grocery costs should begin with the grocery-specific measure, then check actual stores and household spending. Someone evaluating the full move needs a wider budget that includes rent or mortgage costs, utilities, transportation, health care, and other expenses relevant to that household.
A grocery ranking is therefore one input, not a relocation verdict. It can point toward a question without answering every financial question that follows.
Turn an index into a household budget check
Start with the household’s own spending. Review recent grocery receipts, bank statements, or budgeting records and separate food purchases from restaurant meals, household supplies, personal care items, and other charges that may have been grouped together. The goal is not perfect accounting. It is a usable baseline that reflects how the household actually shops.
Next, identify the shopping pattern that would continue after a move. A household that plans to use a discount grocer should not validate its budget only against prices at a specialty market. A household that depends on a nearby convenience store, prepared meals, or delivery may need to account for that pattern rather than building a budget around the lowest shelf price available.
A small personal price check can help with local planning. Compare a short list of staples bought regularly at stores available in both locations, or at comparable stores near each potential home. This may reveal where the household could shop, which products deserve substitution, and whether the proposed grocery budget feels plausible.
That check has a specific purpose. It is a shopping decision, not a way to prove or disprove a citywide index. A handful of products cannot represent the wider set of items, retailers, and communities used in a broad comparison.
Use the index difference carefully

If two city figures use the same defined baseline, period, and geographic unit, a reader can use the difference as a planning signal. For example, a higher grocery index in a target location may justify adding a cushion to the food line in a draft budget. The index difference should not be treated as a guaranteed increase in the household’s bill, because the household may buy a different mix of products or shop at different stores.
If the baseline or geography is unclear, do not convert the score into a percentage adjustment. Mark the result as “needs more research” and move to local price checks instead. That approach is less tidy than multiplying a current grocery budget by a headline number, but it avoids giving false precision to an unclear comparison.
Larger budget categories deserve their own review. Housing, income, childcare, insurance, and commuting may have a greater effect than a modest difference in grocery prices, depending on the household. The relevant comparison is not simply “Which city has cheaper food?” It is “What would the entire monthly budget look like in each place?”
That means a target city with a higher grocery measure could still fit the household’s finances if other costs, income, or commuting needs differ. A lower grocery measure does not automatically make a move affordable if housing or transportation costs create a larger gap elsewhere.
A practical checklist before acting on a ranking
Before using a claim about the most expensive cities for groceries in the U.S., take these steps:
- Verify the geography. Confirm whether the figure covers a city, metro area, or participating communities.
- Verify the period and baseline. Make sure the two locations were measured on the same terms.
- Separate the grocery index from the composite cost-of-living score.
- Compare the result with the household’s own recent food spending.
- Check comparable stores and staple prices near the actual neighborhoods under consideration.
- Add the grocery estimate to a full budget that includes housing, income, transportation, insurance, and other household-specific costs.
The C2ER data has enough breadth to serve as a starting point for that process. Its grocery measure is built around selected surrogate categories, not every purchase a household makes, and the supplied research does not provide enough detail to turn an unnamed city score into a guaranteed monthly bill.
The sensible next move is straightforward: verify the geography, period, and baseline, then test the grocery signal against personal spending and local store prices. Use the index to decide what to investigate, not to skip the investigation.
